

Super Bowl LIII is in the books, and with the conclusion of the New England Patriots’ championship parade, the NFL off-season is officially underway.
Nevertheless, post-game analysis from this year’s Big Game continues. For Extreme Networks, Official Wi-Fi Analytics Provider of Super Bowl LIII, our understanding of how fans engaged with the in-stadium Wi-Fi network continues as well.
In our official Super Bowl LIII Wi-Fi Infographic, we already highlighted some of the notable usage metrics from this year, including:
While 24.05 TB of data included the entire event – pre-game, game, and post-game – this is still a colossal amount of data; it’s an increase from 16.31 TB recorded at last year’s Super Bowl and an incredible 7x increase in data transferred since Super Bowl XLVII at MetLife Stadium in NJ, which saw 3.2 TB of data.
The growth underscores the broader mobile and digital trends impacting all industries today: users and their devices more frequently connect to and rely on public Wi-Fi networks. Once connected, how users, devices, and applications leverage Wi-Fi continues to require greater coverage and capacity – especially at major events like the Super Bowl, where client density and volume are at amplified levels. These habits have forced an evolution in the Wi-Fi technologies supporting them, as such we’re now collecting almost absurd amounts of data (like 24.05 TB) transferred across Wi-Fi.
Just how much is 24.05 TB of data? Roughly, 24TB of data is equal too:
Tough to fathom, isn’t it? While the sheer amount of data transferred is noteworthy, equally interesting is how Wi-Fi usage changed during key points of the game – and the event as a whole. The two graphs below document how fans engaged with Wi-Fi throughout the course of Super Bowl LIII, by demonstrating connected clients and bandwidth in the first chart, and highlighting application usage for three of the top five social platforms in the second chart – Instagram, Facebook, and Snapchat.
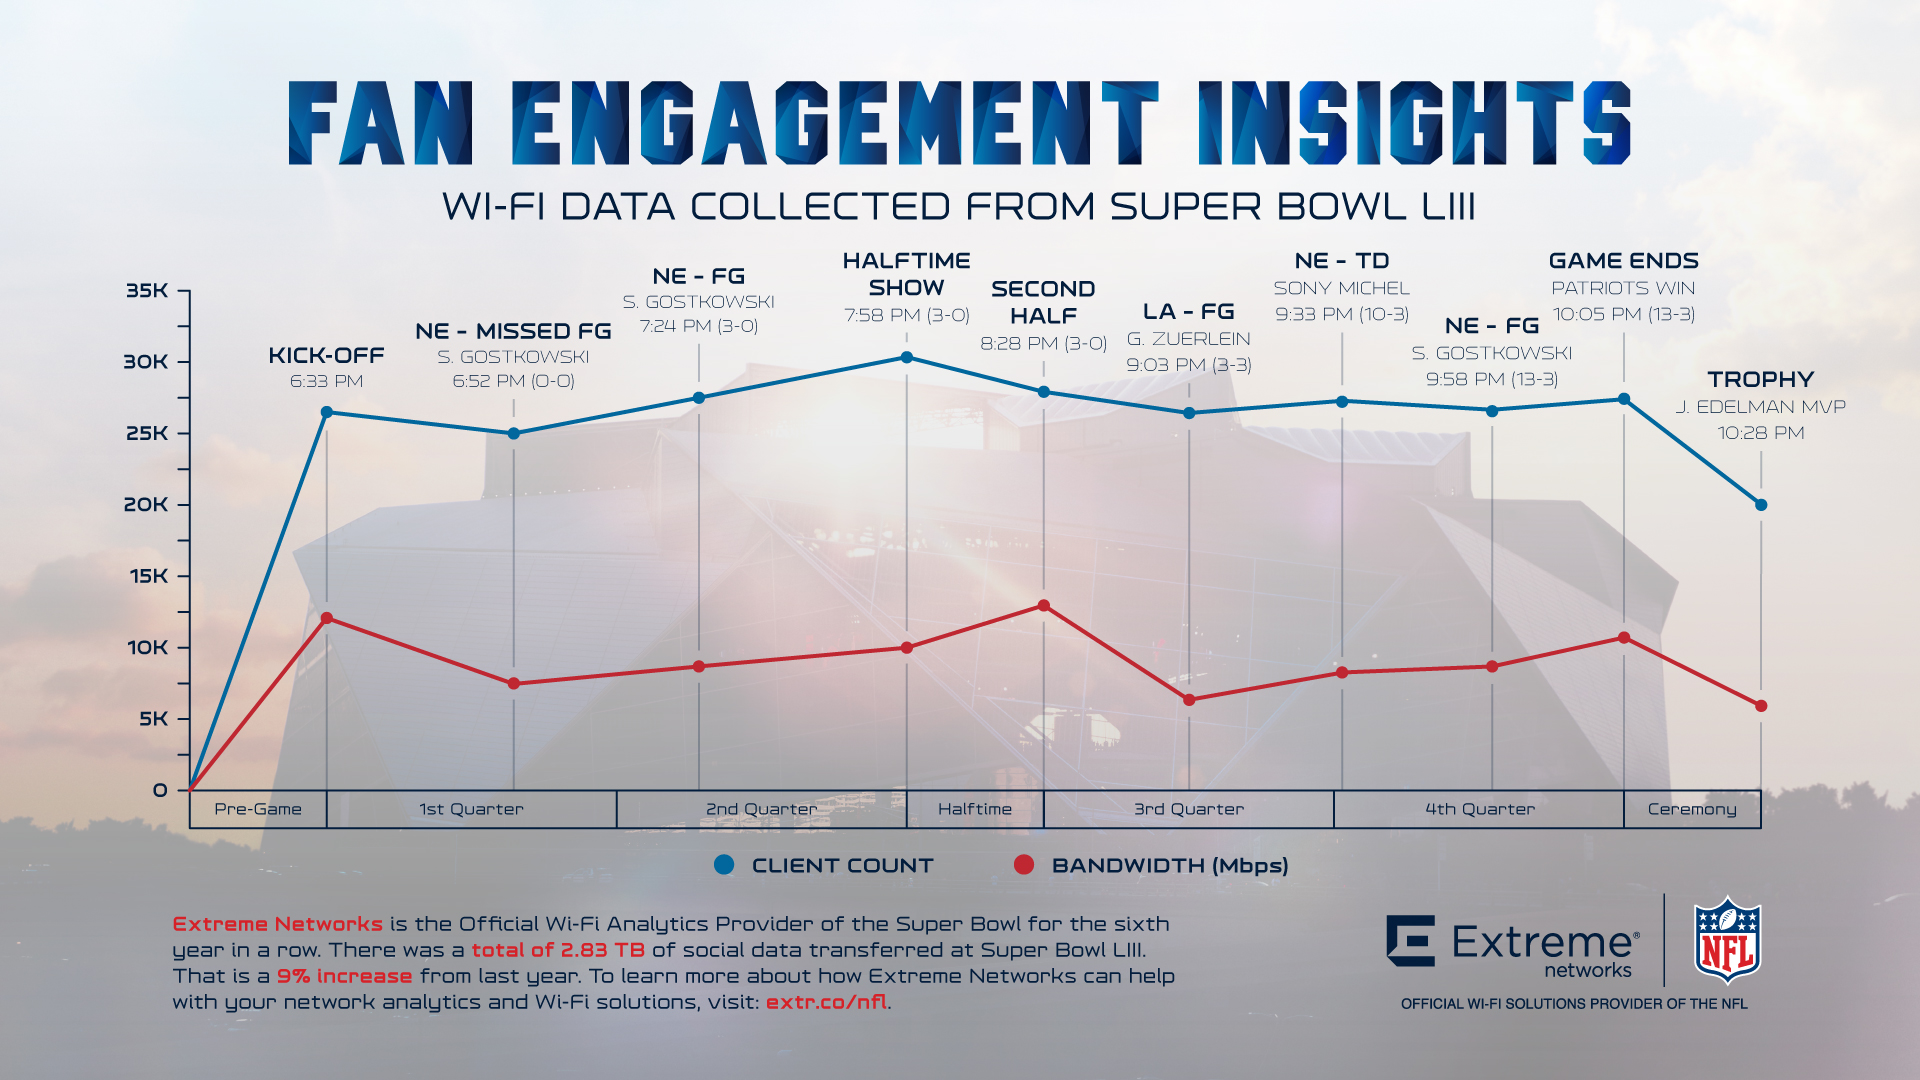
This Super Bowl was more of defensive battle so splashy, game-changing plays were not as frequent compared to previous years. However, we can still correlate on-the-field action with increased network engagement. This begins with the Super Bowl kick-off and National Anthem, where over 26K fans were on Wi-Fi anticipating the start of the game. Client count hovered around this number until the Super Bowl Halftime Show. Whether fans loved the performance or not it seemed like their sentiments were shared, as the network spiked to over 30K connected users, the peak number of concurrent connections during the entire event. The final significant spike was at the end of the game when the Patriots sealed the win, where about 28K fans were connected to Wi-Fi.
In the next two charts, we go a step deeper in the data, by documenting how fans engaged with and how much bandwidth was consumed by three of the more popular social media apps utilized during the game, also calling out the same key moments in the chart above.


Many of the social media insights in this chart generally mirror the high-level Wi-Fi activities displayed in the first chart. It shouldn’t come as a surprise to any of us that fans are active on social media, and in turn enjoy sharing their experiences with their personal networks, especially a high-profile experience like the Super Bowl. What may be more telling is how social media usage among fans evolves over time, from one Super Bowl to the next.
Facebook, Instagram, and Snapchat aren’t only the most-used social apps at the Super Bowl, they’re arguably the most popular social media platforms among users today, which makes the Super Bowl a fascinating sample size for and potential commentary of broader social engagement trends. For example, Facebook continues to see the highest number of fans using the app at and throughout the Super Bowl. This trend is evident in the chart above, depicting connected clients using social platforms. However, in terms of the bandwidth consumed by a given app, Instagram has overtaken both Facebook and Snapchat in this category.
An astounding 1TB of data was consumed by Instagram this year via Wi-Fi, more than any other social media platform, and this number was achieved with nearly 16K less fans connecting to Instagram compared to Facebook. Why the change? One may argue it’s the integration of Instagram ‘Stories,’ which now has 500 million active daily users and enables a Snapchat-like functionality for users, who can now share temporary videos and images as well as apply various filters and content enhancements. Not only has this feature pulled users away from Snapchat, Instagram Stories consumes more bandwidth to function properly, whether users upload to the app or download and view content from their social network. Both are more bandwidth intensive than simply posting to a news feed. Perhaps both are contributing factors. Either way, it’s evident that Wi-Fi usage at the Super Bowl isn’t just one of the biggest ‘networking events’ on the calendar year, it’s also a strong sample for how users are engaging with a digital platform across all industries.
Learn more about how Extreme Networks helps power an enhanced fan experience across the NFL, by visiting our NFL partnership page.
